mail us  |  mail this page

contact us
training  | 
tech stuff  | 

ZING ..... the "Energizer Bunny"

The following, full size, screen shots shows various aspects of ZING functionality.

ISDN Routers

Notes:

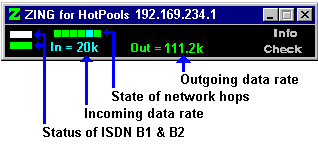
  1. The Gateway address is 'discovered' automatically and displayed on the title bar.
  2. Incoming and Outgoing data rates are displayed as the average over the last 8 seconds in K bits per second. Colour coding shows the % of link capacity being used.
  3. Placing the mouse over the Network Nodes display will show node information - see 'Bubble Help' below.
  4. Placing the mouse over the ISDN channel display will provide additional information.

Wireless Routers

Notes:

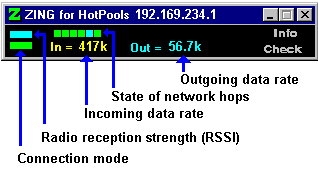
  1. The Gateway address is 'discovered' automatically and displayed on the title bar.
  2. Incoming and Outgoing data rates are displayed as the average over the last 8 seconds in K bits per second. Colour coding shows the % of link capacity being used.
  3. Placing the mouse over the Network Nodes display will show node information - see 'Bubble Help' below.
  4. The Radio reception strength indicator is colour coded. Placing the mouse over this indicator will display additional information including short and long term performance of this parameter.
  5. The Connection mode indicator is colour coded. Placing the mouse over this indicator will display additional information including the mode of connection (direct or 'daisy-chained') and the adjacent node addresses and Access Point address.

Bubble Help

Notes:

  1. This screen shows the 'bubble' help displayed when the mouse is placed over a network node. The information displayed includes the Node's IP address (the '(c)' indicates this value has changed). C=10ms is the current response time of the node in milliseconds. A=22ms is the average response time since monitoring was started (the 'long term' average). WA=10ms is a sliding average showing the nodes performance over the last 10 minutes (the 'short-term' average).

Network Only Monitoring

Notes:

  1. ZING may be used in 'Network Only' mode with ZYTRAX or non-ZYTRAX products as a general purpose monitoring tool.
  2. The Gateway address is 'discovered' automatically and displayed on the title bar.
  3. Incoming and Outgoing data rates are shown as 'idle' since only network monitoring is functional.
  4. Placing the mouse over the Network Nodes display will show node information - see 'Bubble Help' above.


Problems, comments, suggestions, corrections (including broken links) or something to add? Please take the time from a busy life to 'mail us' (at top of screen), the webmaster (below) or info-support at zytrax. You will have a warm inner glow for the rest of the day.

products

support home
NetWidget
air-frame

resources

on-line help
tech info
faqs
open guides

If you are happy it's OK - but your browser is giving a less than optimal experience on our site. You could, at no charge, upgrade to a W3C STANDARDS COMPLIANT browser such as Mozilla

[an error occurred while processing this directive]

Site

CSS Technology SPF Record Conformant Domain
Copyright © 1994 - 2024 ZyTrax, Inc.
All rights reserved. Legal and Privacy
site by zytrax
hosted by javapipe.com
web-master at zytrax
Page modified: January 20 2022.